Recreational Boating Accident Statistical Data Charts
In 2020, Across the United States, there were 5265 Accidents — 3191 resulted in non-fatal injuries property damage; 2240 resulted in non-fatal injuries; 767 were fatal per U.S. Coast Guard Accident Reports. Updated August, 21, 2021.
Deaths, Injuries, Accidents
by year from 2001-2020
Recreational Vessels Registered
by Year from 2001-2020
Source: U.S. Department of Homeland Security U.S. Coast Guard.
2020 Injuries & Deaths
Source: U.S. Department of Homeland Security U.S. Coast Guard.
Source: U.S. Department of Homeland Security U.S. Coast Guard.
USCG Funded Data Charts
Links to data charts with interactive graphics allowing you todrill down to additional detail or view side-by-side comparisons. These fantastic charts were created with funds from the Sport Fish Restoration & Boating Trust Fund administered by the USCG as Recreational Boating Safety Grants. using USCG data. Chart visualization dashboards are stored on idashboard data servers, embedded within the National Association of State Boating Law Administrators (NASBLA) website and can be accessed from the links below..
Boating Incident Data - State
Boating Incident Data – National
Boating Incident Data – Contributing Factors
Paddlecraft Incidents & Fatalities
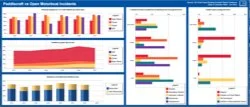
Paddlecraft vs Open Motorboat Incidents & Fatalities


